
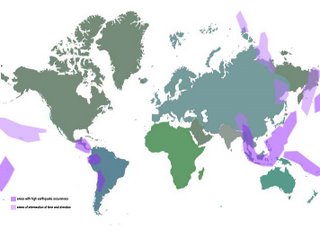
Fault lines are located at the edges of the tectonic plates, which are constantly in motion. Along these lines, the movement of the plates is made aware by the occurances of earthquakes. Because of these disasters and the physical and economical damage that they cause, there are seismic monitors that record the earth's reverberations and can even predict future occurances. The images include earthquake data over a period of 2 1/2 months. The fault lines, although not physically represented, start to appear by the earthquake patterns that occur over this short amount of time. Columns appear to grow from the epicenter of an earthquake. [the height of the column represents the magnitude of the earthquake measured by the Richter Scale 1-9.9] These columns extend in a plane depending on time since occurance and direction of tectonic plate movement at each specific location. When you look at the mappings, notice the high frequency of earthquakes in the Southeast Asian area specifically.
[
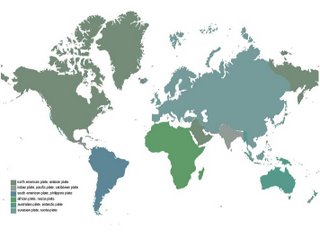
basemap for the earthquake mappings showing each tectonic plate by color]
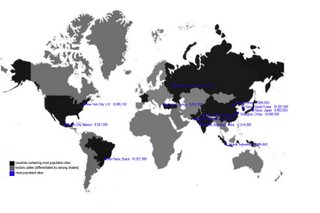
Earthquakes are much more common in specific areas than others, even along the fault lines. One expanation is that population density correlates with seismic occurance. High population and conscentration of buildings puts pressure on the earth and has been known to cause plate movements and earthquakes. The locations of the top 13 most populated cities in the world and their countries support this theory.
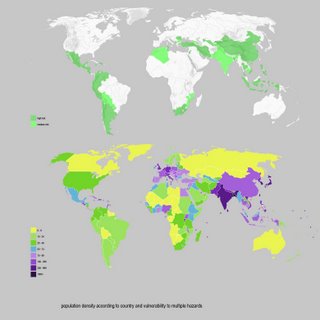
Not only risk of earthquakes, but risks of other natural disasters or phenomenons have an apparent correlation with population. Here you can see the comparison of countries that are vulnerable to more than one hazard, whether risk of hydro, drought, or geophysical, and the population density by country. This is apparent even when looking at countries alone.
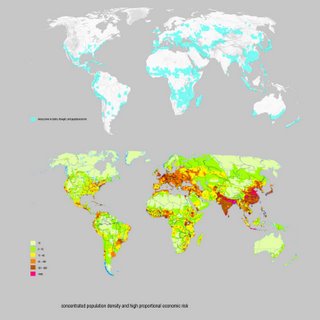
Here the risks and population density are pinpointed for exact locations of risk occurance and more accurate population numbers.
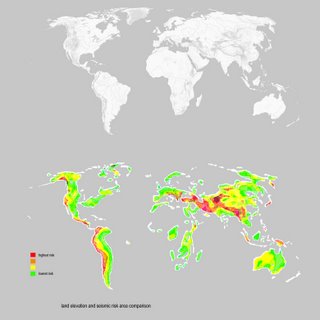
Another theory, taken from Pangaea, is that mountains and valleys are created or were created by the movement of the tectonic plates. In comparing the occurances of earthquakes to the elevation map, you can see that where there is the highest seismic risk, there usually lies a mountain range, a coastline, or both. In the ocean, ridges and trenches are formed, although these are not apparent at ground level. Earthquakes that occur along the fault lines located in the oceans can cause tsunamis and changes of elevation. These highs and lows are representative of the collision and separation of the plates over a long period of time.
[
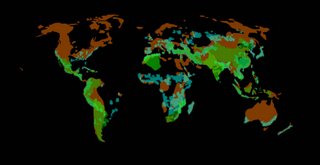
This image shows an overlay of global risks and vulnerabilty]
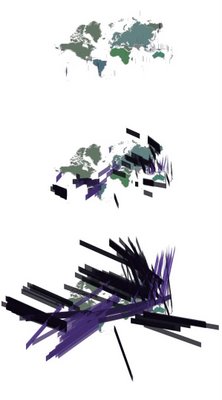
The direction of the constant plate movement is apparent and time causes these conditions to intersect. Frequency and density of the earthquakes create masses that are the beginnings of a new world.
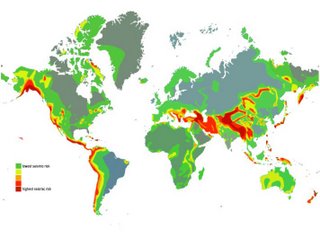
My proposal for a new world begins to be shaped from my earthquake mappings conscentrating focus on areas of highest seismic risk. Based on the patterns shown in the maps, earthquakes were more prevelant and had more impact in these areas. Seismic cities could be built in existing areas of risk and new seismic cities could be built in the intersections of earthquake planes. These cities would be constructed with lightweight and economical materials to resist forming great pressures on the earth. Population in these areas could grow specifically in the new cities, as the old cities would be redesigned.
 Fault lines are located at the edges of the tectonic plates, which are constantly in motion. Along these lines, the movement of the plates is made aware by the occurances of earthquakes. Because of these disasters and the physical and economical damage that they cause, there are seismic monitors that record the earth's reverberations and can even predict future occurances. The images include earthquake data over a period of 2 1/2 months. The fault lines, although not physically represented, start to appear by the earthquake patterns that occur over this short amount of time. Columns appear to grow from the epicenter of an earthquake. [the height of the column represents the magnitude of the earthquake measured by the Richter Scale 1-9.9] These columns extend in a plane depending on time since occurance and direction of tectonic plate movement at each specific location. When you look at the mappings, notice the high frequency of earthquakes in the Southeast Asian area specifically.
  [basemap for the earthquake mappings showing each tectonic plate by color]
 Earthquakes are much more common in specific areas than others, even along the fault lines. One expanation is that population density correlates with seismic occurance. High population and conscentration of buildings puts pressure on the earth and has been known to cause plate movements and earthquakes. The locations of the top 13 most populated cities in the world and their countries support this theory.
  Not only risk of earthquakes, but risks of other natural disasters or phenomenons have an apparent correlation with population. Here you can see the comparison of countries that are vulnerable to more than one hazard, whether risk of hydro, drought, or geophysical, and the population density by country. This is apparent even when looking at countries alone.
 Here the risks and population density are pinpointed for exact locations of risk occurance and more accurate population numbers.
  Another theory, taken from Pangaea, is that mountains and valleys are created or were created by the movement of the tectonic plates. In comparing the occurances of earthquakes to the elevation map, you can see that where there is the highest seismic risk, there usually lies a mountain range, a coastline, or both. In the ocean, ridges and trenches are formed, although these are not apparent at ground level. Earthquakes that occur along the fault lines located in the oceans can cause tsunamis and changes of elevation. These highs and lows are representative of the collision and separation of the plates over a long period of time.
 [This image shows an overlay of global risks and vulnerabilty]
 The direction of the constant plate movement is apparent and time causes these conditions to intersect. Frequency and density of the earthquakes create masses that are the beginnings of a new world.
 My proposal for a new world begins to be shaped from my earthquake mappings conscentrating focus on areas of highest seismic risk. Based on the patterns shown in the maps, earthquakes were more prevelant and had more impact in these areas. Seismic cities could be built in existing areas of risk and new seismic cities could be built in the intersections of earthquake planes. These cities would be constructed with lightweight and economical materials to resist forming great pressures on the earth. Population in these areas could grow specifically in the new cities, as the old cities would be redesigned.
No comments:
Post a Comment