Known for it's vast marshes, more than one third of The Netherlands is below sea level. However, the country is one of the most populated in europe and the third largest agricultural exporter in the world. The precious land is said to be slowly sinking when it dries out, and the north sea is rising over time, therefore the North Sea Wall exists to protect The Netherlands from the harsh North Sea.

This image shows which parts of Holland are above sea level (red) and which areas are below sea level or vulnerable because of possible flooding (blue).

The Dutch have gone to extremes in building this massive wall, but what they don't know is if it will continue to withstand the North Sea. They have discussed the possibility of building elevated roads, houses, and even cities to avoid problems of population and flood damage. Although protecting the land is a first priority to continue success in agriculture, there is always a possibility to build cities above the land or sea.

The Maeslant Barrier is one part of the Delta Works. These arms, if stood up, would each be the height of the Eiffel Tower and weighing four times as much.

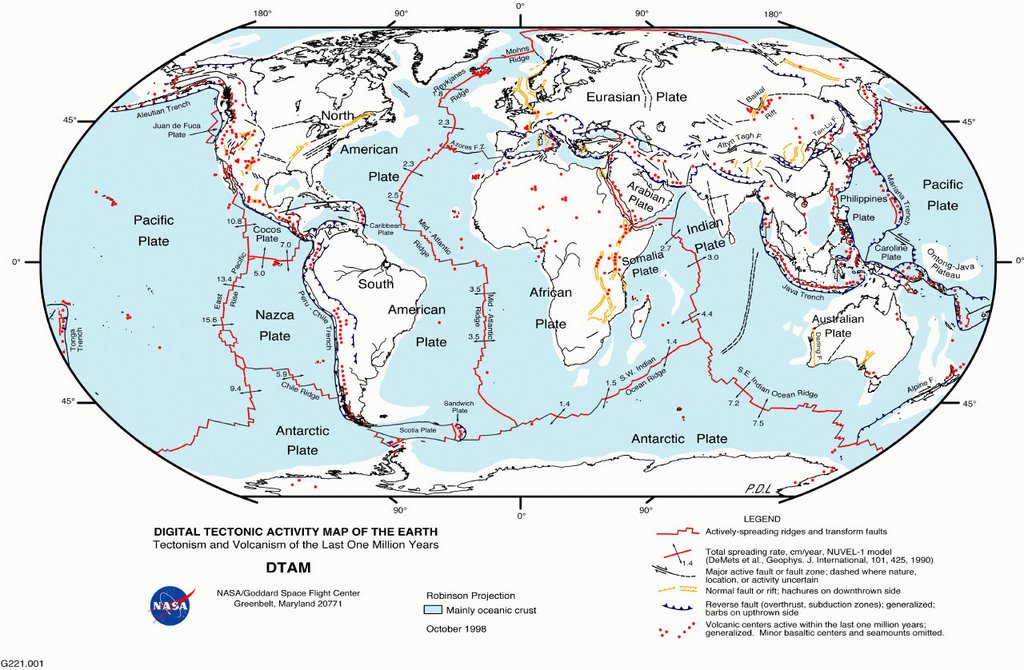

 [map shows the high risk areas of earthquakes in the United States]
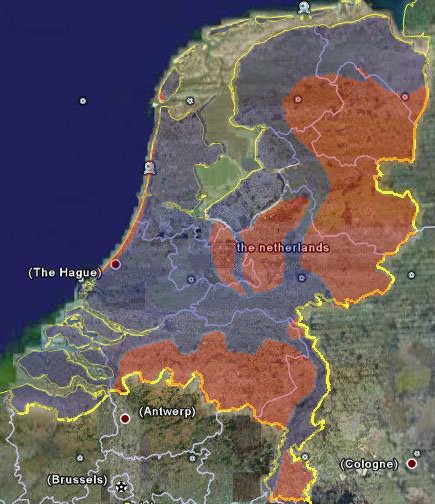 This image shows which parts of Holland are above sea level (red) and which areas are below sea level or vulnerable because of possible flooding (blue).
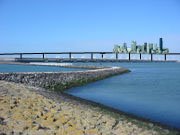 The Dutch have gone to extremes in building this massive wall, but what they don't know is if it will continue to withstand the North Sea. They have discussed the possibility of building elevated roads, houses, and even cities to avoid problems of population and flood damage. Although protecting the land is a first priority to continue success in agriculture, there is always a possibility to build cities above the land or sea.
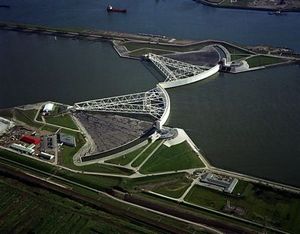 The Maeslant Barrier is one part of the Delta Works. These arms, if stood up, would each be the height of the Eiffel Tower and weighing four times as much.